small samples
Why the league table lies until October
Eight games in, the table is a rumour. The gap between where a team sits and how well it is playing is mostly noise, and the noise takes until autumn to burn off. Here is how much of it is luck.
21 July 2026 · 6 min read · James Frewin
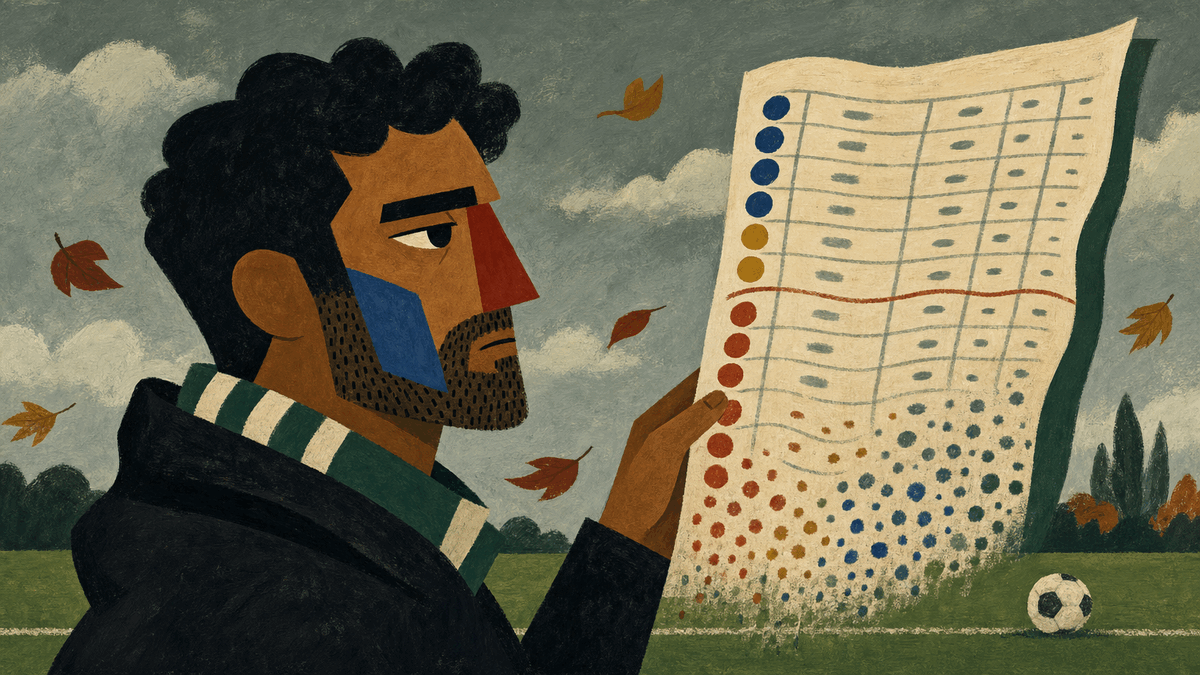
By late September the verdicts are in. Someone is “title material this year”, someone is “in a relegation battle”, a manager is one defeat from the sack. All of it rests on the league table, and the league table, eight games in, is a small sample wearing the costume of a fact. The costume is convincing because it is the same table that will be true in May. In September it is mostly weather.
Eight games is nothing
A football match is close to a weighted coin toss. The better team wins more often, but a deflection, a red card or a goalkeeper’s afternoon regularly hands the points the other way; that is most of why anyone watches. Over 38 games those bounces largely cancel. Over eight they do not. Early season, every fluke is a big slice of the total, and a team’s points can sit four or five points from its true level through luck alone, which in a compressed autumn table is half a dozen places. Fourth and fourteenth can be, and regularly are, the same team quality wearing different luck.
The noise never fully disappears; it shrinks with the square root of the games played. That square root is why the table sharpens quickly at first, why October is the traditional point where it starts to mean something, and why even a 38-game table settles arguments to within a few points and no further.
What to look at instead
The fix is to count what stabilises fastest. Points count outcomes, and outcomes are the noisiest thing on the pitch. Expected goals counts the chances created and conceded, which is a bigger sample from the same matches: a team takes a dozen shots a game but scores from very few. A side sitting third while creating little is usually a side finishing hot, and finishing runs cool. A side twelfth while dominating its games is usually fine. The early table sorts teams by what went in; the chances sort them by what they keep making happen.
The table is a scoreboard, not a measurement. Early in the season those are very different jobs.
The stories arrive before the evidence
None of this stops the verdicts, because narrative does not wait for sample size. The crisis club in September is often a decent team on a cold streak; the surprise package is often an ordinary one on a hot streak; both get explained with tactics, mentality and body language, and both tend to drift back toward their underlying numbers as the games pile up. Regression to the mean is not a force pulling teams about. It is just what it looks like when the luck runs out of a small sample, the same effect behind the new-manager bounce and most streaks people call momentum.
How the model handles it
Touchline’s numbers are built to resist the September trap. Team rates are anchored to a longer view and to the consensus of forecasts, then nudged as real evidence accumulates, so eight loud games move the number a little rather than rewriting it. That is also why simulating the season ten thousand times produces bands rather than a table: the honest output of an early season is a range of finishes, not a position.