the gap
Why most promoted teams go straight back down
Every August three clubs come up believing. The gap is bigger than one division's width, the budgets compound it, and a 38-game season gives variance no room to rescue anyone. Why, in numbers.
21 July 2026 · 6 min read · James Frewin

Promotion day is the happiest day in football, and the numbers are waiting to ruin it. Across the Premier League era, somewhere around two promoted sides in five have gone straight back down; lately it has been worse than that, and in the 2023–24 and 2024–25 seasons it was all six. That is not a curse and it is not a mentality problem. It is a gap the league table is built to hide, meeting a season too long to be lucky in.
The table understates the cliff
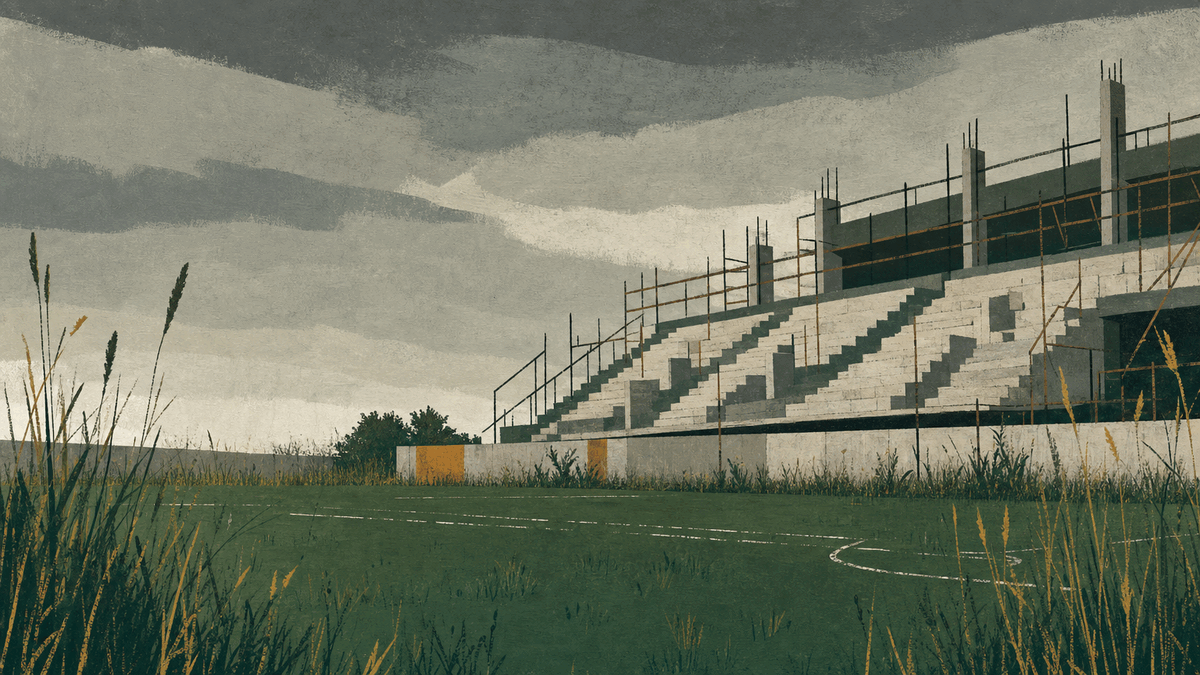
Winning the Championship tells you a team was the best of one population. Surviving the Premier League requires something different: not being among the worst three of a much stronger population. Between those two sentences sits a cliff. The sides a promoted club must now beat are backed by broadcast revenues and wage bills that Championship football cannot approach, and money in football buys goals with depressing reliability. In the model’s terms the step up shows as a swing at both ends, fewer goals expected for and more expected against, arriving at once and lasting all season.
The cruelty is that the gap has been widening. Parachute payments soften relegation for the sides coming down, which strengthens the next promotion race, which sends up clubs into an ever-richer league. The revolving door is partly a wealth machine spinning.
Thirty-eight games is too many to be lucky
None of this makes a promoted team hopeless on any given Saturday, and that is the part intuition gets wrong. A clearly weaker side still wins single matches routinely; an opening-day upset means almost nothing either way. What a weaker side cannot reliably do is keep doing it, because points accumulate and noise cancels.
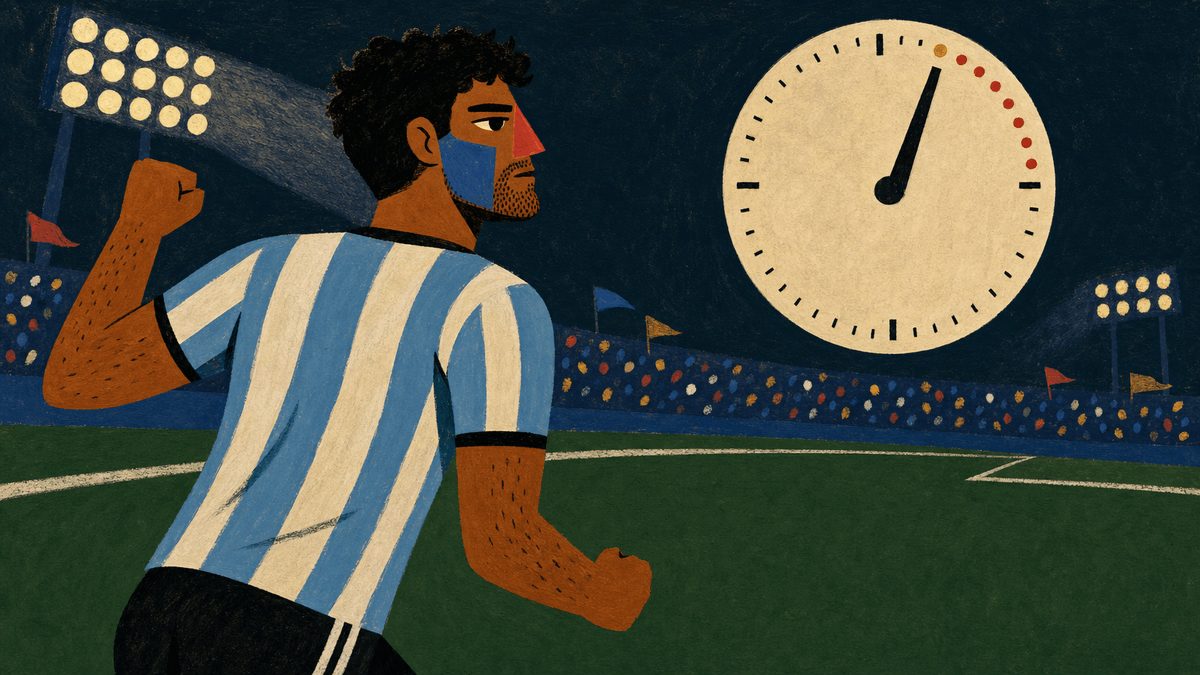
This is the same square-root arithmetic that makes the early table a liar, run in reverse: over eight games variance can dress a struggler as a contender, but over 38 it strips every costume. A team half a point per game short of survival pace needs the luck to keep arriving for ten months. It almost never does.
A cup tie is one coin flip. A season is thirty-eight, and the coin remembers who is better.
The exceptions are informative
Promoted sides do survive, some emphatically, and the survivors share a shape. They tend to be the clubs whose underlying numbers were already closest to Premier League standard: squads assembled with the top flight in mind, recruitment done before the parade, a way of playing that does not depend on being the better team, because they usually will not be. The story version credits belief. The ledger version is that they were less far behind than the table suggested, so the season had less to expose.
What the model does with a promoted team
It prices honestly and without sentiment: goal rates set against top-flight opposition, which typically makes a promoted side the underdog in most fixtures and near the bottom of a simulated season’s finishing bands. Not doomed, priced: a probability of survival, with the working shown, revisable as the evidence arrives.