the low-score fix
Why simple football models miss the draw (and the fix)
A simple scoreline model gets the low scores wrong: too few 0-0s and 1-1s, too many 1-0s. The fix, a small 1997 correction called Dixon-Coles, puts the draws back. How it works, plainly.
21 July 2026 · 6 min read · James Frewin
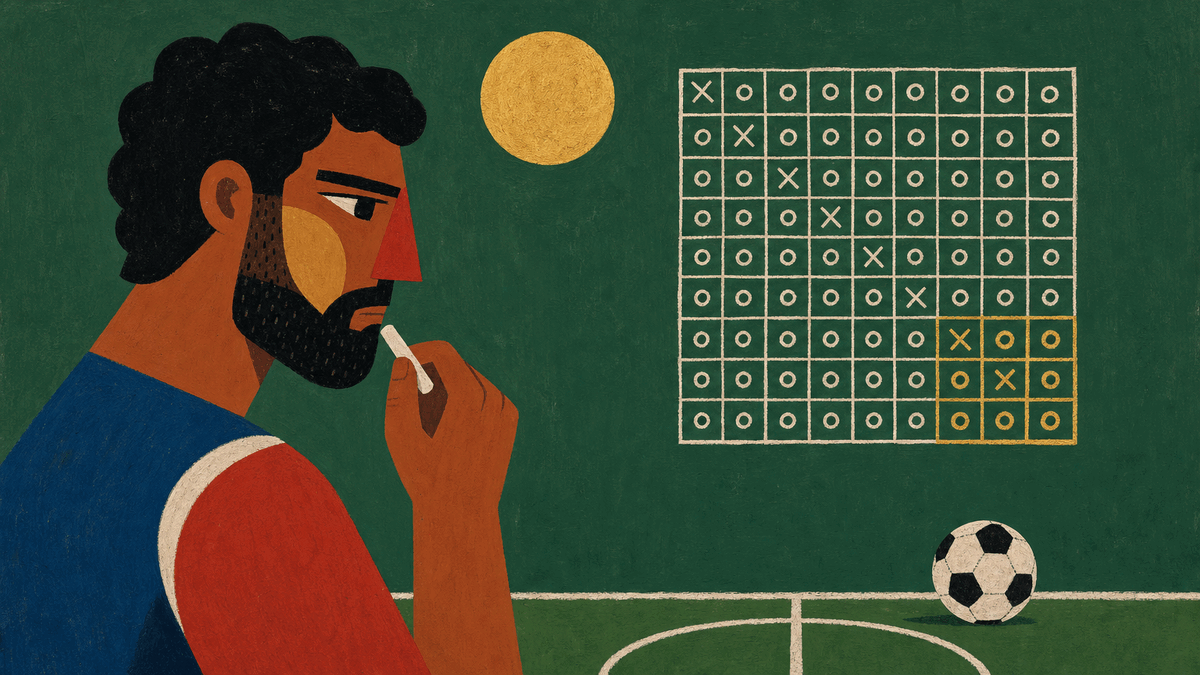
A Poisson model is the honest first move in football forecasting, and for good reason. Give each team a scoring rate, treat goals as rare events that arrive at that rate, and the distribution hands you the chance of zero, one, two, three goals apiece. Multiply the two teams together and you have a full grid of scorelines from one afternoon’s arithmetic. It is simple, it is fast, and it is roughly right. It is also, in one specific way, wrong.
Where the plain model comes from
The plain version draws each team’s goals separately. Spain’s number comes out of Spain’s rate, Argentina’s out of Argentina’s, and the model assumes the two have nothing to do with each other. Under that assumption the chance of any exact scoreline is just one team’s probability times the other’s. Clean, but it smuggles in a claim that does not survive contact with real football: that the two teams’ goal counts are independent.
For most scorelines that assumption barely matters. The trouble is concentrated, and it is concentrated exactly where a lot of football lives: the low scores.
The problem lives in the low scores
Line a plain Poisson model up against decades of real results and a pattern falls out every time. It predicts too few 0–0s and 1–1s, and too many 1–0s and 0–1s. Put another way, it does not produce enough draws, and the draws it misses are the tight, low-scoring ones.
The reason is that independence breaks down when the game is cagey. A tense, low-scoring match suppresses both teams at once: the same closed, careful state of play that keeps one side to zero tends to keep the other side low too. The scorelines move together. Independent Poisson cannot see that, so it splits the difference into one-goal wins where the real world produced a stalemate.
The fix does not need to touch the whole grid. It only needs to reach into that top-left corner, the handful of lowest scores, and correct them.
Dixon and Coles, 1997
That is exactly what Mark Dixon and Stuart Coles proposed in a 1997 paper that still anchors most football modelling. Their fix is small and surgical. A correction factor, usually written as the Greek letter tau, is applied to just the four lowest scorelines: 0–0, 1–0, 0–1 and 1–1. A single extra parameter, fitted to data, controls how hard it pulls. It nudges the two low draws up and the two low one-goal wins down, then leaves every other scoreline exactly as the plain Poisson had it.
Dixon and Coles added a second idea in the same breath: a time-decay weighting, so a match from last month counts for more than one from two seasons ago. A team is not a fixed thing, and recent form should carry more weight. Together, the low-score correction and the decay turn a decent first approximation into a genuinely sharper one, with most of the gain showing up on draws and low-scoring games, which is where the plain model was leaking.
The plain model is right almost everywhere. It is wrong in one corner, so that is the only corner worth patching.
How Touchline gets to the same place
Touchline’s engine does not use the Dixon-Coles tau. It reaches the same destination by a different road: a bivariate Poisson with a small shared component. Each team still gets its own rate, but a little extra number, around 0.1, is drawn once per simulated match and added to both teams at the same time. That shared piece is what couples the two scorelines together.
The effect is the one Dixon and Coles were after. Games swing at both ends or stay quiet at both ends, the correlation the independent model was missing is back, and the low scores and draws land closer to reality, without either team’s average changing. Two routes, correction factor or shared component, to the same honest goal: goals that move together, and a draw column you can trust.