the draw
Why the draw is the hardest bet in football
A draw is the outcome fans forget and models keep landing on. Here is why an evenly matched game points at the draw more than either win, straight out of the Poisson maths.
15 July 2026 · 5 min read · James Frewin
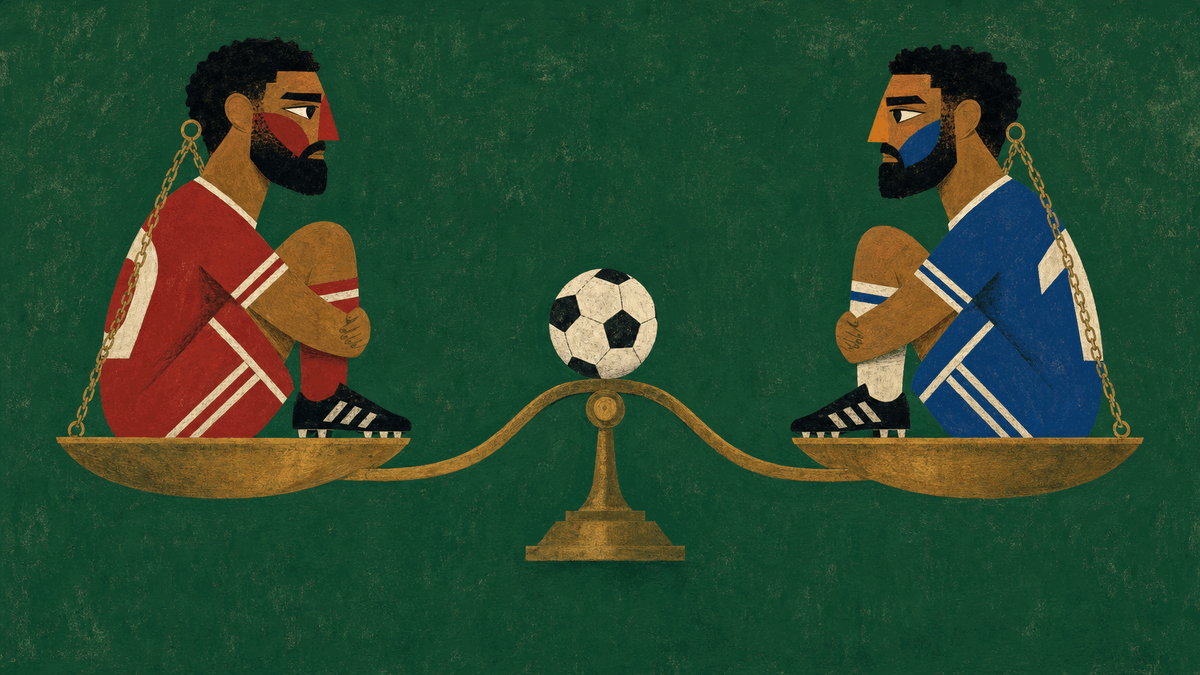
Ask a room who wins on Saturday and everyone has an answer. Ask them about the draw and the room goes quiet. It is the outcome nobody roots for, the one with no hero and no story, and so it is the one people forget to price. The model does not forget it. For a large slice of football matches, the draw is not the boring afterthought. It is, quietly, one of the most probable things that can happen.
Goals are rare, and that is the whole trick
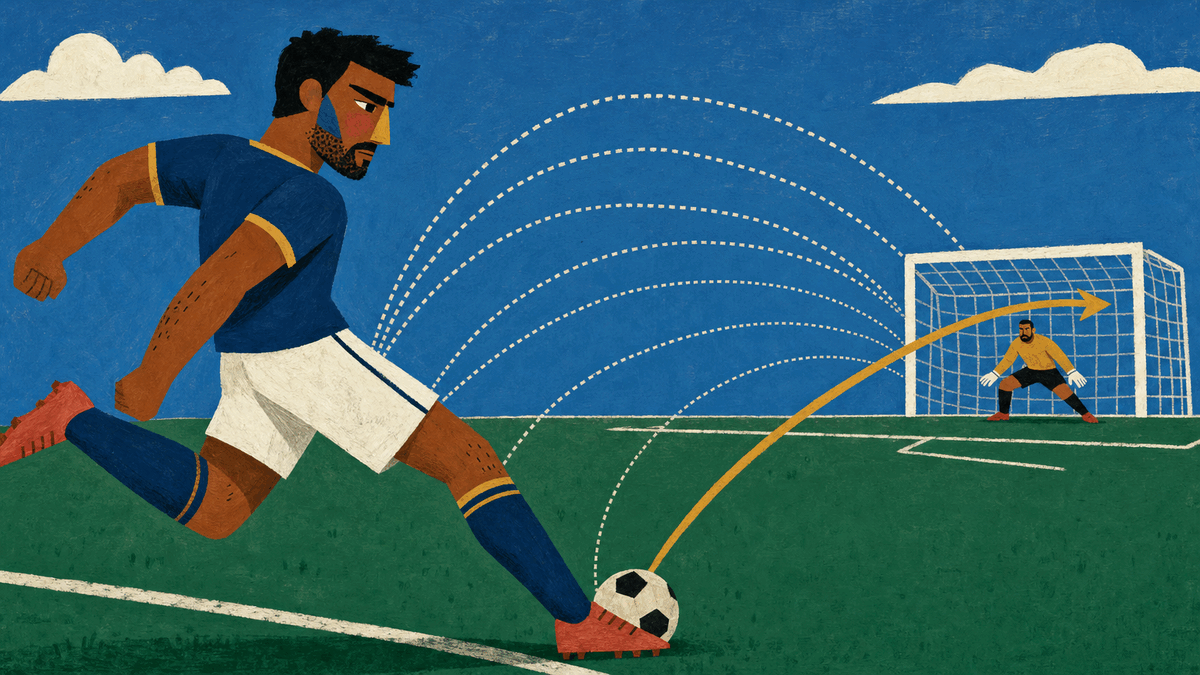
A football match is a small number of rare events strung over 90 minutes. Most games finish with one, two or three goals total, almost never ten. When events are that rare and arrive at a roughly steady rate, they follow a Poisson distribution, the same shape that describes buses arriving or emails landing in an hour. You do not need the formula. You need one consequence of it: when a team is expected to score about one goal, the most likely number it actually scores is one, and zero is close behind.
Now put two of those teams on the same pitch. If both are expected to score around a goal, the scoreline the maths keeps landing on is 1–1. Not because the draw is special, but because low, level scores are where all that probability piles up. A 3–0 needs three rare things to go one way and none the other. A 1–1 needs almost nothing unusual at all.
Why close and low-scoring points at the draw
Two dials decide everything: how many goals each side is expected to score. Pull them together and drop the total, and the level scorelines fatten up until the draw can overtake either win. Pull them apart, or crank the total, and the draw thins out fast as the extra goals start breaking ties. The toy below runs the exact Poisson sum live, so you can watch the three probabilities move as you drag.
Evenly matched and low-scoring: this is about as fat as the draw gets, 29.1%, still short of either win but far bigger than the price most people put on it.
Drag both dials down together and watch the draw fatten as the goals drain out: with two even sides it overtakes either win only once each is expected to score below roughly 0.85 goals. That is not a quirk of the widget. It is the honest arithmetic of a sport where most games are tight and goals are scarce, and it is the part casual prediction skips straight over.
Newcastle v Liverpool, a live 24%
Take a real fixture. Touchline’s model of the 2026/27 opener at St James’ Park makes it Newcastle 32%, draw 24%, Liverpool 44%, an open game with over 2.5 goals a 60% shot and both teams to score at 63%. Liverpool are the clear favourites to win the match. And yet the single most likely exact score the model spits out is 1–1. The draw is the least probable of the three headline results here, and 1–1 is still the most probable scoreline of all. Those two facts sound like they should fight. They do not, and that gap is the entire point.
The favourite can be the most likely winner while the draw is the most likely score. Both are true at once.
The bet with no story
This is why the draw is the hardest bet in football. People think in win or lose, so the draw is chronically underweighted even when the number is large. It is hard to back because there is nothing to picture: no last-minute winner, no player to name, just a game that ends where it started. The probability is real and often bigger than the room assumes, but it lives on the one outcome nobody wants, and no amount of maths makes that feel exciting.
The lesson is not that you should pile onto every draw. It is that your gut, tuned by a lifetime of pictured winners, systematically shades the level result down, and a Poisson model quietly shades it back up. When a game is tight and the goals are likely to be few, respect the draw. The model does.
See the 24% for yourself
Run the Newcastle v Liverpool model, watch the draw hold its quarter, find the 1–1.