the engine
Bivariate Poisson, explained without the maths
Every Touchline scoreline comes out of one model. Here is how it works, in plain language: two rates, a shared bounce, and a hundred thousand imagined matches.
10 July 2026 · 6 min read · James Frewin
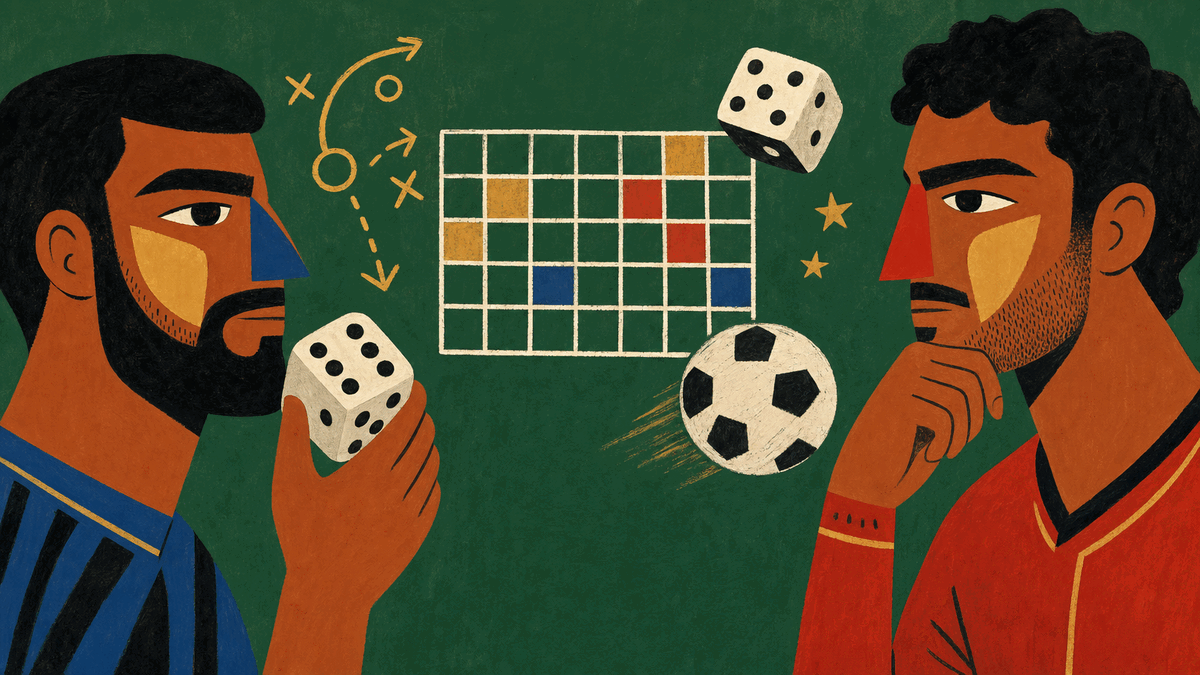
Every match page on Touchline runs on one model, and it is the same handful of steps each time: give each team a scoring rate, allow for the fact that goals arrive in clusters, then play the match out tens of thousands of times and count what happens. The name for it is a bivariate Poisson simulation, which reads like a wall and is not. Here is the whole thing in plain language.
One number per team
It starts with expected goals. Each team gets a single number: how many goals it should score in this match on average, given who it is playing. Spain against this Argentina defence come out around 1.3. Argentina against Spain, about 1.1. Call it the rate. That rate is where all the judgement lives, form, injuries, who is fit, how the two styles meet. Everything after it is arithmetic.
The rate is an average, not a forecast. A team that “should” score 1.3 will quite often score none or one, sometimes two, now and then three or more. The job of the model is to turn that one average into the full spread of how many goals actually land.
Why goals follow a Poisson
A goal is a rare event. It can happen at almost any moment, and for the most part one does not depend on the last. That is exactly the shape of thing the Poisson distribution was built to describe: rare, roughly independent events arriving at a steady rate. Feed it a rate of 1.3 and it hands back the chance of exactly zero goals, exactly one, exactly two, and so on down the line.
Drag the home slider in the panel below and watch that spread redraw. At a low rate the tall bar sits over zero and one. Push the rate up and the weight slides right, toward two and three. The bars always add up to one whole match. This is the first half of the model, done for each team on its own.
The bounce, and the word bivariate
If that were the whole story you would draw each team’s goals separately and stop. But a real match is not two teams playing in separate rooms. A stretched, end-to-end game tends to be open at both ends; a tight, nervy one stays low for both. Goals move together. Draw the two sides as if they were strangers and you miss that.
So the model adds a small shared component, about 0.1, drawn once per match and added to both teams at the same time. That shared piece is the entire word bivariate. It nudges the model toward games that swing both ways and away from the neat, sterile spread you would get from treating the teams as independent, and it does so without changing either team’s average. That is the trick, borrowed from the football-modelling literature: keep the two rates honest, add the correlation on top.
The numbers on the bars are the chance of that many goals, as a percentage. Multiply a home bar by an away bar and you get one exact score. Touchline does this 100,000 times per match, with a shared bounce added on top, and counts what comes out.
Why play it out, instead of predicting a score
Here is the part people skip. You cannot sensibly predict a single scoreline, because no single scoreline is likely. Even the most probable exact result in a given match is usually under 15%. Anyone who tells you the game will finish 2–1 is guessing at a one-in-seven shot and hoping you forget the other six.
So the model does not try. It plays the match 100,000 times. Each run draws a home number, an away number, and the shared bounce, adds them up, and writes down the result. One run might finish 1–0, the next 2–2, the next a goalless draw. Over a hundred thousand of them the noise cancels and the real frequencies settle down.
A score is a guess. A hundred thousand scores are a distribution, and a distribution you can actually reason about.
Everything on the page comes from that one run
Once you have played the match out, every number answers itself by counting. How often did the home team finish ahead? That is the win probability. Count the draws, count the away wins, and you have the three-way result. Count the runs where the two teams combined for three or more: that is over 2.5 goals. Count the ones where both scored: both teams to score. The most likely scoreline is simply the exact result that came up most.
That is why a Touchline page can show a win bar, a heatmap of scorelines, over 2.5, both to score, and a list of likely results, all at once and all agreeing with each other. They are not five separate models. They are five different counts of the same set of imagined matches.
Seeded, so you can trust the slider
One last thing that matters more than it sounds. The random generator is seeded. Same rates in, same result out, every time, on my machine and yours. When you move a slider on a match page and the win number shifts, it shifted because the input changed, not because the dice landed differently. Reload the page and the model tells you the same thing. That is the difference between a toy and an instrument.
See it on a real match
Move the two rates on the final, watch the win bar and the likely scores follow.